You can debug both the JVM COBOL and Java code in the same process. 


               -  
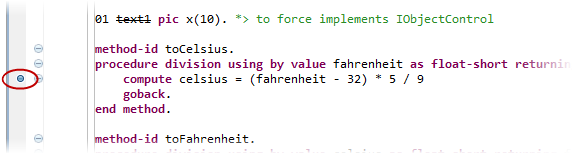
                  		  Set a breakpoint in the JVM COBOL code: 


                     -  
                        				In the Project Explorer, choose 
                           				  . 


                        The JVM COBOL business logic appears in the main pane. 
                           				  
                         
-  
                        				Double-click the marker bar to the left of the 
                           				  compute statement in the 
                           				  toCelsius method. 


 The breakpoint is set.
-  
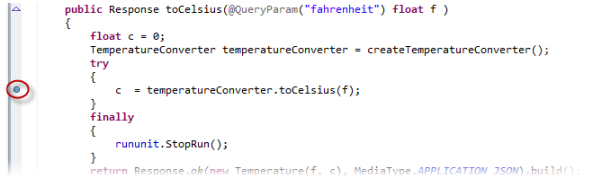
                  		  Set a breakpoint in the Java code: 


                     -  
                        				In the Project Explorer pane, choose 
                           				  . 


                        The Java code appears in the main pane. 
                           				  
                         
-  
                        				Double-click the marker bar to the left of the 
                           				  c declaration in the 
                           				  toCelsius method. 


 The breakpoint is set.
-  
                  		  Right-click 
                     			 TemperatureConverterPrj, then choose 
                     			 . 


                  This opens the 
                     				Debug On Server dialog box. 
                     			 
                   
-  
                  		  Ensure that 
                     			 Red Hat JBoss EAP 7.1 is selected and click 
                     			 Finish. 


                  You receive a notification that the server is not running in debug mode. 
                     			 
                   
-  
                  		  Ensure 
                     			 Switch mode (will restart if necessary) is selected and click 
                     			 OK. 


                  The server is restarted in debug mode. A browser window is opened in the IDE, showing the following URL: 
                     			  http://localhost:8080/TemperatureConverterPrj/ . You can ignore the HTTP Status code message. EJB does not have a landing page and you need to enter the URL for the application
                     manually. 
                     			  
-  
                  		  In the browser window, load to the following URL: 
                     		   
                  		    
                  			 http://localhost:8080/TemperatureConverterPrj/RestApp1/getCelsius?fahrenheit=212 
-  
                  		  If you are prompted to switch to the 
                     			 Debug perspective, click 
                     			 Yes. 


                  The breakpoint is hit and execution breaks in the Java program. At this point, you can step through the program as normal.


-  
                  		  Press 
                     			 F8 to resume execution. 


                  The 
                     				 compute breakpoint is hit and execution breaks in the JVM COBOL program. 
                     				
                      Note: If you get a 
                        				   Source not found message, perform the following steps: 


                           - Click 
                              						Edit Source Lookup Path. 
                              						
                              This opens the 
                                 						  Edit Source Lookup Path dialog box. 
                                 						
                               
- Click 
                              						Add. 
                              					 
                           
- Click 
                              						COBOL Project. 
                              					 
                           
- Click 
                              						OK. 
                              						
                              This opens the 
                                 						  Selection Needed dialog box. 
                                 						
                               
- Check the 
                              						TemperatureConverter project. 
                              					 
                           
- Click 
                              						OK. 
                              					 
                           
- Click 
                              						OK. 


-  
                  		  Continue debugging, or press 
                     			 Ctrl+F2 to terminate. 
                     		   
                  		   You can click 
                  			 COBOL in the right upper corner of the IDE to switch back to the Team Developer perspective.