Visualizing Relationships
Relationships are accessed from the
Relationships tab and appear in a list. In certain perspectives, you can view your relationships in a diagram. When you see
 above the
Relationships list, click it to open the
Relationships Diagram window. Here's how it works:
above the
Relationships list, click it to open the
Relationships Diagram window. Here's how it works:
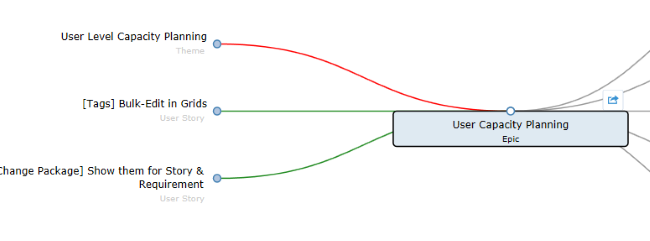
- Items to the left of the Story link to the Story. Items to the right of the selected Story link from the Story.
- The diagram displays an item's first level relationships. Items with child relationships contain a solid blue dot. You can click and navigate to all relationship levels. Cross-project relationships links (where the Story is in another project than the current one) are indicated with a dashed line.
- Select an item and you will see summary information on the top of the window.
- Click
 (Goto) to go to the item in a new browser window/tab.
- The diagram is an infinite scrolling canvas that can be panned via click and drag, and zoomed via the scroll wheel.
- Click Reset to restore the default pan/zoom.
- Click Reload to refresh the diagram.
- Although item names are fixed-length on the diagram, hovering over an item displays a tool-tip with an asset's full Name, ID, Type, and Project Name.
- Select a Relationship Status, Relationship Type, or Item Type to filter the diagram based on your selections.
- If an item is a Change Package, you can open the
Change Package Viewer directly from the diagram. Click the button
 in the viewer.
Relationship Diagrams have indicators to help determine relationship and status at a glance:
- Green lines indicate an Up-to-Date relationship.
- Red lines indicate a Suspect relationship.
- Orange lines indicate a Deferred relationship.
- Gray, solid lines indicate a parent-child relationship.
- Dashed lines indicate a relationship with an external project (cross-project).
- Solid lines indicate a relationship within the current project.
Additionally, if you hover over the connecting lines, status and details appear.
Relationship Diagram Example