Visual Analysis with TrueLog Explorer
One of TrueLog Explorer’s most powerful features is its ability to visually render Web content that is displayed by applications under test. In effect, it shows you what virtual users see when they interact with an application.
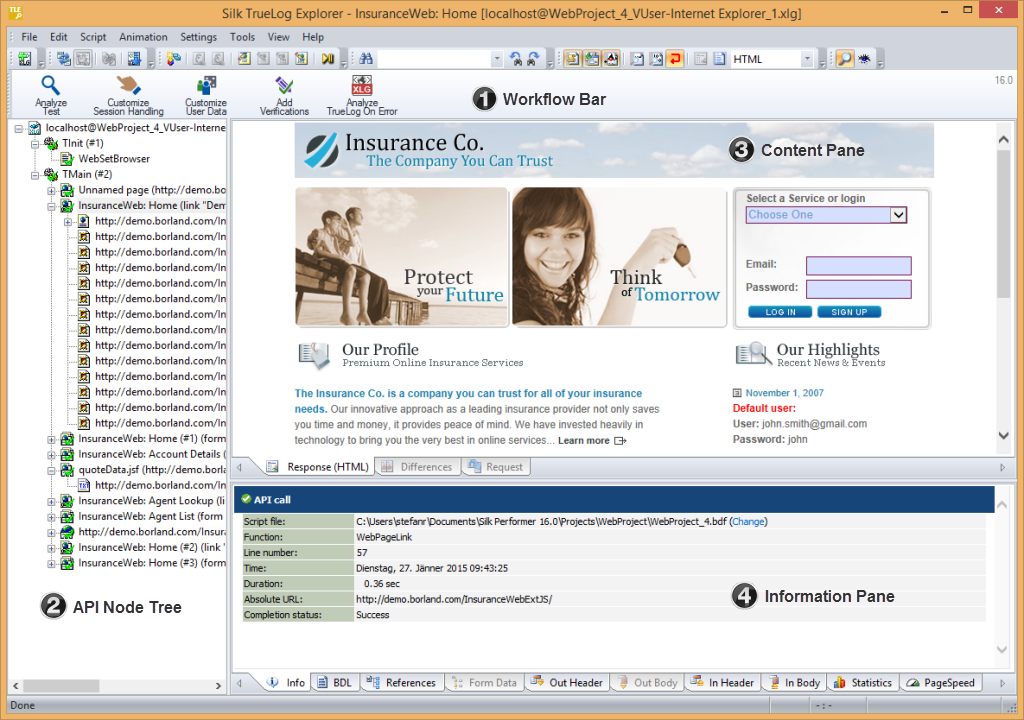
The TrueLog Explorer interface is comprised of the following sections:
- The Workflow Bar acts as your primary interface as you work with TrueLog Explorer. The Workflow Bar reflects TrueLog Explorer’s built-in testing methodology by supporting its five primary tasks.
- The API Node Tree menu on the left of the interface allows you to expand and collapse TrueLog data downloaded during tests. Each loaded TrueLog file is displayed here along with links to all relevant API nodes. You can click a node to display a screen shot in the Screen pane and history details in Information view.
- The Content pane provides multiple views of all received data.
- The Information pane displays data regarding testing scripts and test runs, including general information about the loaded TrueLog file, the selected API node, BDL script, and statistics.
Note: To launch
TrueLog Explorer from
Silk Performer, choose
.